Tensorboard Alpha Features
As many of us know, Tensorboard is the leading tool for visualizing deep neural networks. It provides everything from graphing losses and histograms of weight values to 3D embedding maps of images, or words. Additionally, some Tensorflow users are familiar with the Tensorflow debugger, tfdbg.
Why Do We Need A Debugger
The first question to ask is why does Tensorflow need its own debugger at all?
For those of us less familiar with Tensorflow, you may have noticed a general code flow when building models in Tensorflow. First we define some computation as a series of nodes using declarations like tf.layers.conv1d(...), then we pass data into those computations using a session op = tf.Session().run([training_operation], feed_dict={x: 123}) (we’ll use a feed_dict here, but please read our post on Data Ingestion to find out about other options). So what is the output of this intermediary 1d convolution we’ve defined? In order to actually view the output we have to add the operation to our session run like this op, conv = tf.Session().run([training_operation, conv], feed_dict={x: 123}). What if we had a 100 layers and wanted to see the output at various layers? It gets immediately obvious that this solution does not scale.
So instead, what if you use the python debugger to step through your code? As we saw in another post (Data Ingestion), the python profiler shows the training of our network as a single python operation!
   Ordered by: internal time

   ncalls  tottime  percall  cumtime  percall filename:lineno(function)
      851   24.341    0.029   24.341    0.029 {built-in method _pywrap_tensorflow_internal.TF_Run}
This wouldn’t be particularly useful to step through in a debugger.
Because tensorflow computational graphs are so difficult to debug, the Tensorflow team created tfdbg to allow users to step through graph computations and view intermediary values.
Using The Command Line Debugger
Activating and using Tensorflows command-line debugger is very simple.
from tensorflow.python import debug as tf_debug

sess = tf_debug.LocalCLIDebugWrapperSession(sess)
We can then continue to use our session as usual to run a computational graph, but this time, we run our model with the the --debug flag passed to python.
python DeepCoNN\ -\ feed\ dict.py --debug
From here we get to a view with some instructions on how to start running our computational graph
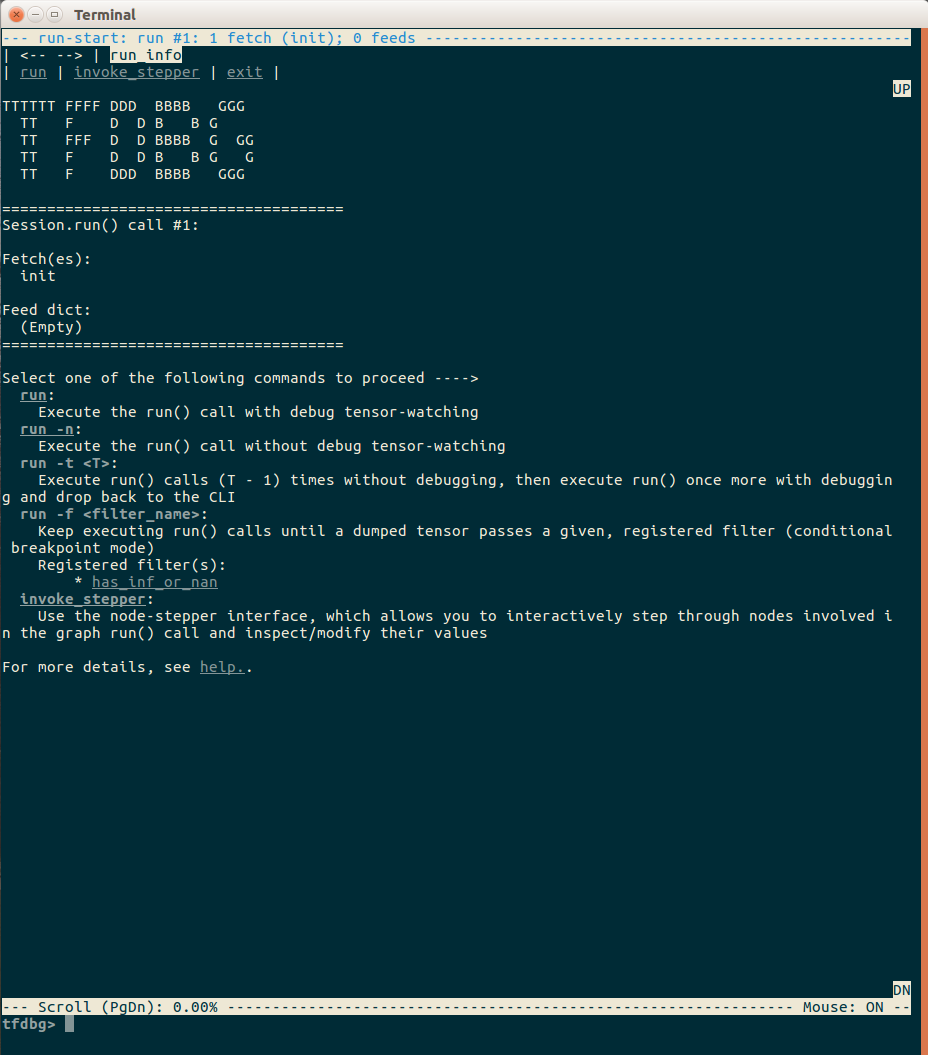
This screen gives us some simple instructions like run to start our computation. After typing run and hitting enter, we can step through our computational graph and view the outputs of different operations!
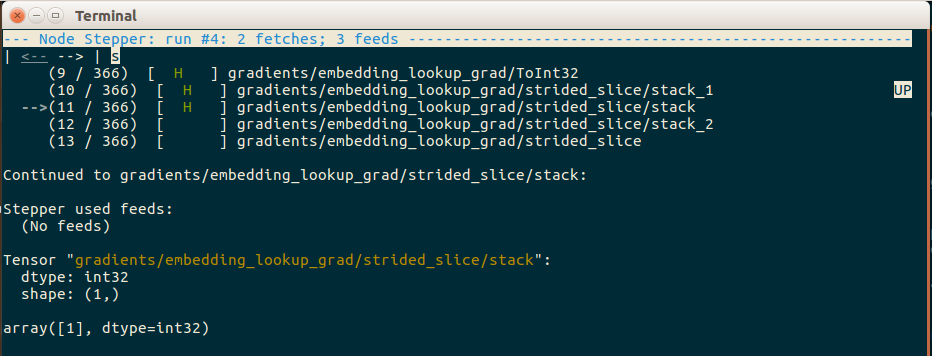
The Tensorflow debugger is an extremely useful tool, especially for finding out where and when gradients are becoming nan or zero, but in our particular case we need more context than what is provided above. To be specific, because our computational graph has two parallel word embedding lookups, one for user reviews and one for item reviews, the above image is not useful because we do not know which of the two is creating this gradient.
A More Friendly Debugger
To ease the use of the Tensorflow debugger, the team also created a visual debugging tool that takes advantage of Tensorboard! Unfortunately, this tool is in a alpha stage and has no official documentation on tensorflow.org outside of a link pointing to a README.
Q: Is there a GUI for tfdbg?
A: Yes, the TensorBoard Debugger Plugin is the GUI of tfdbg. It offers features such as inspection of the computation graph, real-time visualization of tensor values, continuation to tensor and conditional breakpoints, and tying tensors to their graph-construction source code, all in the browser environment. To get started, please visit its README.
We must, however, thank the Tensorflow team, because the included README is thorough. In order to run the visual Tensorflow debugger with a tf.Estimator we simply add the following hook to our train method.
from tensorflow.python import debug as tf_debug
hook = tf_debug.TensorBoardDebugHook("localhost:6060")
s = time.time()
scoring_function.train(input_fn=train_input_fn , hooks=[hook])
From here we have to
- Start tensorboard with the debugger flag listening on the port specified above
- Start training our model
Note that it must be done in this order and we must provide tensorboard with the --debugger_port flag.
tensorboard --logdir=output --debugger_port 6060
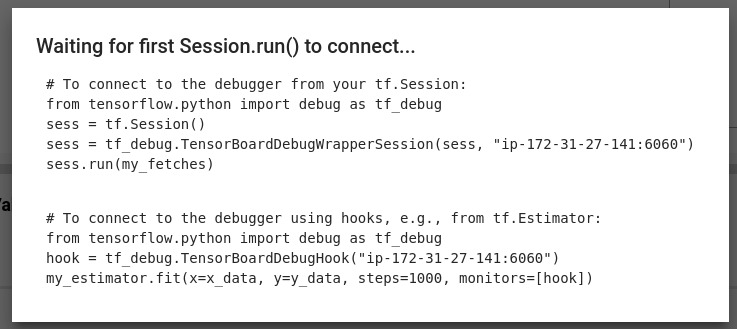
Your tensorboard should now display a Debugger tab in addition to some of the standard tabs. Clicking on said tab gives us the following handy prompt in case you forgot to add the debugger hook.
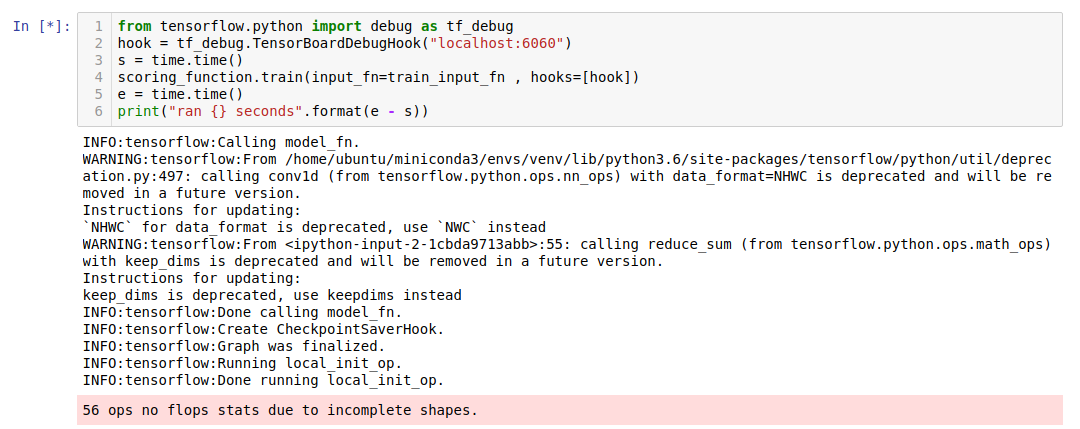
If everything is set up and communicating correctly, then when you run your visual debugger enabled model your execution should pause and display some obscure message like 56 ops no flops stats due to incomplete shapes. Unclear what this means, but I have taken it as a symbol that the debugger has stopped our model execution and is waiting for us to provide a command.
Looking back at tensorboard and the visual debugger now, we already have much more context than the command line tools. We can clearly see all our computational graph operations and tensors as well as which device those operations take place on.
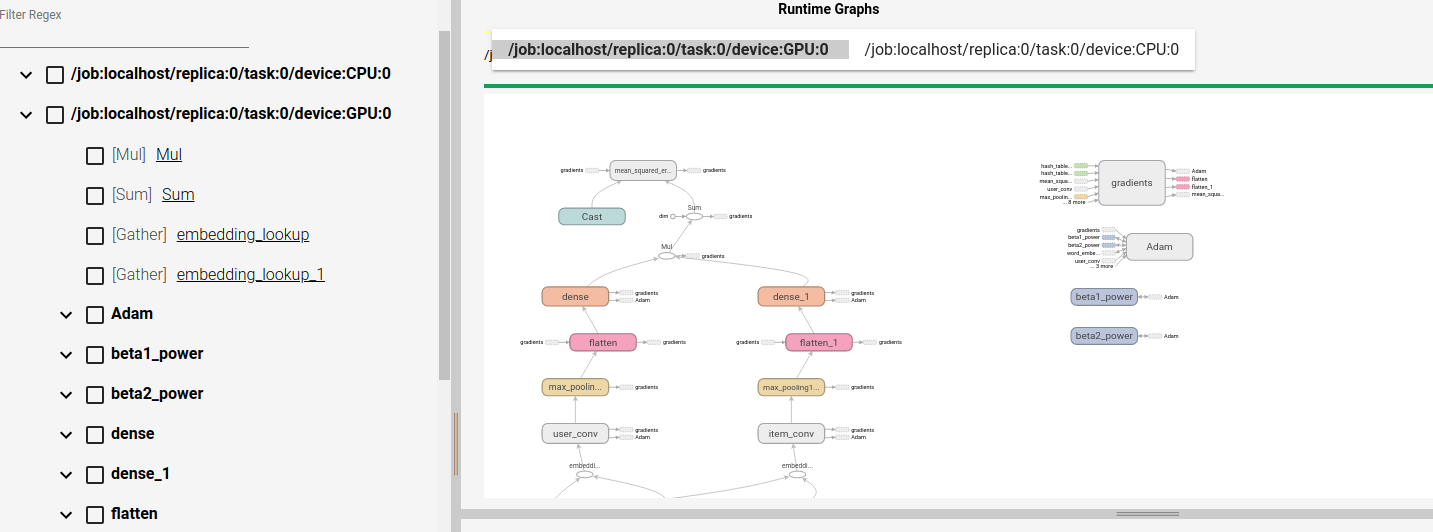
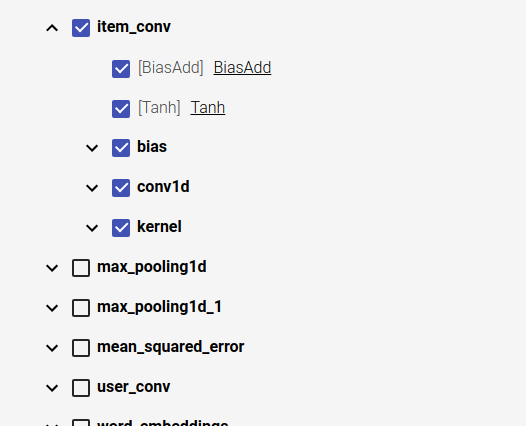
From here we can select a specific computation or variable, then monitor that computation through graph execution. For the purposes of this example I will select a convolution operation.
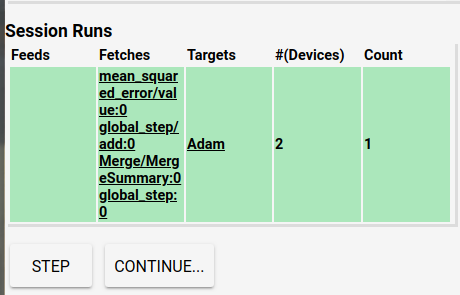
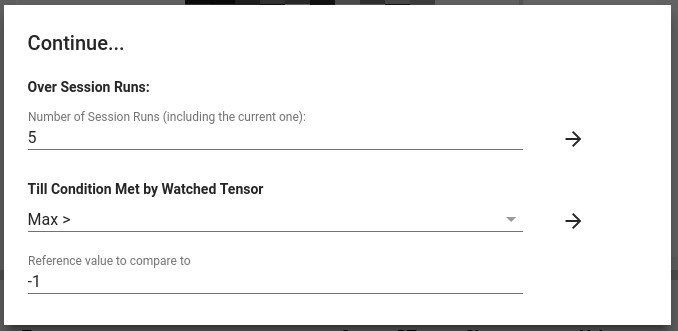
Now we can tell Tensorboard to continue running the debugger until some specific break conditions are met. For example we can run our model over 5 different sessions waiting until one of our selected tensors meets one of the provided conditions. This is menu and set of options is reached by clicking the Continue button in the bottom left. For purposes of the demonstration we will wait for some condition that is almost guaranteed to be true, like waiting for the max value of any of our watched tensors to be greater than -1. This condition should be just about guaranteed true because of our random initialization.
After one of the conditions are met we get some very useful data on our selected operation and can even montor the value of our tensors. By hitting the continue button we can also watch the debugger loop through an iteration until it returns to the currently monitored tensor.
Although Tensorflow debugging can often be unruly the Tensorflow team and community have put a significant amount of time into developing tools that give us insight into their graph computation. Currently the visual debugger is only in an alpha release, but I could easily see a future where connecting the visual debugger is automatic. The visual debugger in particular could be an extremely useful tool for understanding how neural networks learn, or demonstrating things like networks that do not converge due to high learning rates. Even as an alpha release I see use for the visual debugger to understand how tensorflow models execute and why they either fail or work well. I am looking forward to seeing where the Tensorflow team takes this feature set in the future.